Application Insights is the new analytics platform from Microsoft, currently in preview and part of Visual Studio Online. I had the honor of giving a talk on Application Insights during Danish Developer Conference last week which was very exciting. I plan to write a walk through of the new service soon, but for now I will address a small issue people run into.
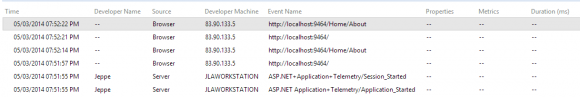
Application Insights has a great development feed that provides raw and instant analysis data that can be used to verify that you send the right data before shipping your app:
So, you have a web solution, you added Application Insights using the Application Insights Tools extension (or the functionality included if you use VS2013 Update 2 RC) to your solution, and then inserted some JavaScript analytics code that you got from the Application Insights portal into your views that looks like the following:
window.appInsights={queue:[],applicationInsightsId:null,accountId:null,appUserId:null,configUrl:null,start:function(n){function u(n,t){n[t]=function(){var i=arguments;n.queue.push(function(){n[t].apply(n,i)})}}function f(n){var t=document.createElement("script");return t.type="text/javascript",t.src=n,t.async=!0,t}function r(){i.appendChild(f("//az416426.vo.msecnd.net/scripts/ai.0.js"))}var i,t;this.applicationInsightsId=n;u(this,"logEvent");u(this,"logPageView");i=document.getElementsByTagName("script")[0].parentNode;this.configUrl===null?r():(t=f(this.configUrl),t.onload=r,t.onerror=r,i.appendChild(t));this.start=function(){}}};

appInsights.start("some guid that identifies your application");
appInsights.logPageView();
And all psyched up, you hit F5 while, at the same time, you have the Application Insights portal open on the stream data page. Ready to see the logs of you browsing around your site, you see that nothing shows. Except for the two server logs that gently tells you everything is ok and that a telemetry session has started. If you have any server side event loggings these show up just fine, but any client side events and page views logged in JavaScript does not.
Configure Streaming Data for JavaScript Analytics
First of all – do check the Visual Studio Online Service Blog. Application Insights is in preview and service level is not guaranteed at this time.
The best way is to set up the JS to load the values from the ApplicationInsights.config file that is added to the solution when you add Application Insights via. Visual Studio. This file contains a two profiles by default- one for Development and one for Production. The Application Insights SDK correctly switches between these when you run in the solution in Debug and Release mode respectively. As you can see, the Development profile has the following element that ensures that server side events logged using the API, are sent directly instantaneously to the feed in debug mode:
 <Profile name="Development">
    <ServerAnalytics enabled="true">
        <DataUploadIntervalInSeconds>0.1</DataUploadIntervalInSeconds>
        ...
        <SendToRawStream>true</SendToRawStream>
    ...
    </ServerAnalytics>
</Profile>
Part of the .NET SDK, is the ConfigurationHandler type in the Microsoft.ApplicationInsights.Telemetry.Web namespace. This type generates the JavaScript code that sets up configuration client-side based on the profile that is active server-side. The ConfigurationHandler type implements IHttpHandler. First we need to add in the Web.config an endpoint that invokes the handler to generate the JavaScript code. Add the following to your web config file as a child of the <system.web> element:
<httpHandlers>
    <add path="ApplicationInsights.axd" verb="*"
type="Microsoft.ApplicationInsights.Telemetry.Web.ConfigurationHandler"/>
</httpHandlers>
Change your JavaScript analytics code to the following:
<script type="text/javascript">
window.appInsights={queue:[],applicationInsightsId:null,accountId:null,appUserId:null,configUrl:null,start:function(n){function u(n,t){n[t]=function(){var i=arguments;n.queue.push(function(){n[t].apply(n,i)})}}function f(n){var t=document.createElement("script");return t.type="text/javascript",t.src=n,t.async=!0,t}function r(){i.appendChild(f("//az416426.vo.msecnd.net/scripts/ai.0.js"))}var i,t;this.applicationInsightsId=n;u(this,"logEvent");u(this,"logPageView");i=document.getElementsByTagName("script")[0].parentNode;this.configUrl===null?r():(t=f(this.configUrl),t.onload=r,t.onerror=r,i.appendChild(t));this.start=function(){}}};

appInsights.configUrl = "/ApplicationInsights.axd";
appInsights.start();
appInsights.logPageView();
</script>
Run your solution again in Debug mode and voila. The configuration file is now used to configure the client-side as well. If you want to see the the generated JS that is injected, just navigate to http://localhost:xxx/ApplicationInsights.axd. (Note that if you create a new solution in VS2013 with Update 2 RC, and tick Application Insights to be added, this is how it will set up new solutions!)
You can also configure it purely client-side. The JS API is not very well documented (actually not at all) in terms of setting up profiles. And for good reason – the above method should be used, since any configuration done in JavaScript will have to be maintained separately. It will also not switch between debug and release automatically. However, here is how it would look like:
<script type="text/javascript">
window.appInsights = { queue: [], applicationInsightsId: null, accountId: null, appUserId: null, configUrl: null, start: function (n) { function u(n, t) { n[t] = function () { var i = arguments; n.queue.push(function () { n[t].apply(n, i) }) } } function f(n) { var t = document.createElement("script"); return t.type = "text/javascript", t.src = n, t.async = !0, t } function r() { i.appendChild(f("//az416426.vo.msecnd.net/scripts/ai.0.js")) } var i, t; this.applicationInsightsId = n; u(this, "logEvent"); u(this, "logPageView"); i = document.getElementsByTagName("script")[0].parentNode; this.configUrl === null ? r() : (t = f(this.configUrl), t.onload = r, t.onerror = r, i.appendChild(t)); this.start = function () { } } };

appInsights.configuration = {
    activeProfile: "debug",
    profiles: {
        debug: {
            componentId: "some guid that identifies your application",
            sendToRawStream: true
        }
    }
};

appInsights.start();
appInsights.logPageView();
</script>
And that is it – happy debugging your analytics!